source - http://www.ex-parrot.com/%7Echris/wwwitter/20050407-it_doesnt_matter_how_you_vote_either_way_your_planet_is_doomed.html
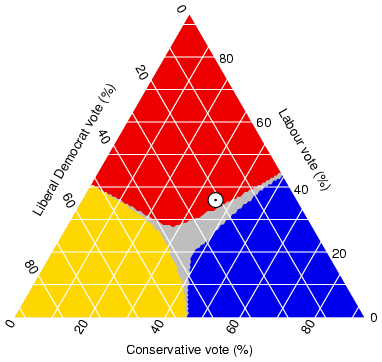
Triangular Plots are those plots that have three variables that can be produced into one constant. It usually that you have an a, b, c and thay all have to add up to 100 to be considered to plot like this. The plot above is a estimated ratio of populations who intends to vote for the major parties. The pattern is that votes are most likely to vote for liberal democrat than labour vote. This plot is very much used when plotting things that have so much relationships with each other it can be compared at all the same times.
No comments:
Post a Comment