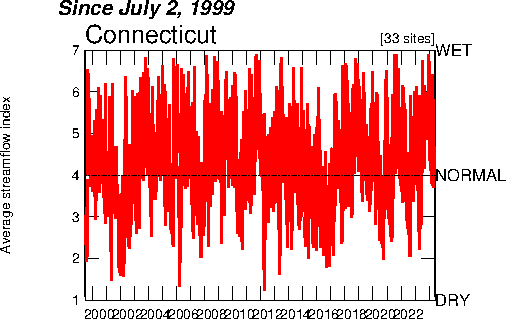
Source - http://waterwatch.usgs.gov/index.php?r=ct&m=real&w=real%252Cplot
Index Value Plot is a plot that compares the difference in a two variables over a period of time. In this particular index value plot it uses Connecticut to compare the average streamflow and how wet normal or dry in was. All this really is a connection of dots throughout the time 1999 through 2012. There is not much a pattern in this just that every year has sometime dry and wet streamflow.
No comments:
Post a Comment